Please start from this link every time you shop on Amazon
We are a participant in the Amazon Services LLC Associates Program, a program designed to provide for sites to earn fees by linking to amazon.com. Each time you shop on Amazon.com, simply start from
[ https://LegendaryPharma.com/amazon ]. Starting here will not interfere with signing in to your existing Amazon account. It will take you to your usual account. You will get your usual low prices, shipping, lists, and services. Please click over there now and bookmark it for future use. As an Amazon Associate, we earn from qualifying purchases.
| |
ACKNOWLEDGEMENTS and REFERENCES
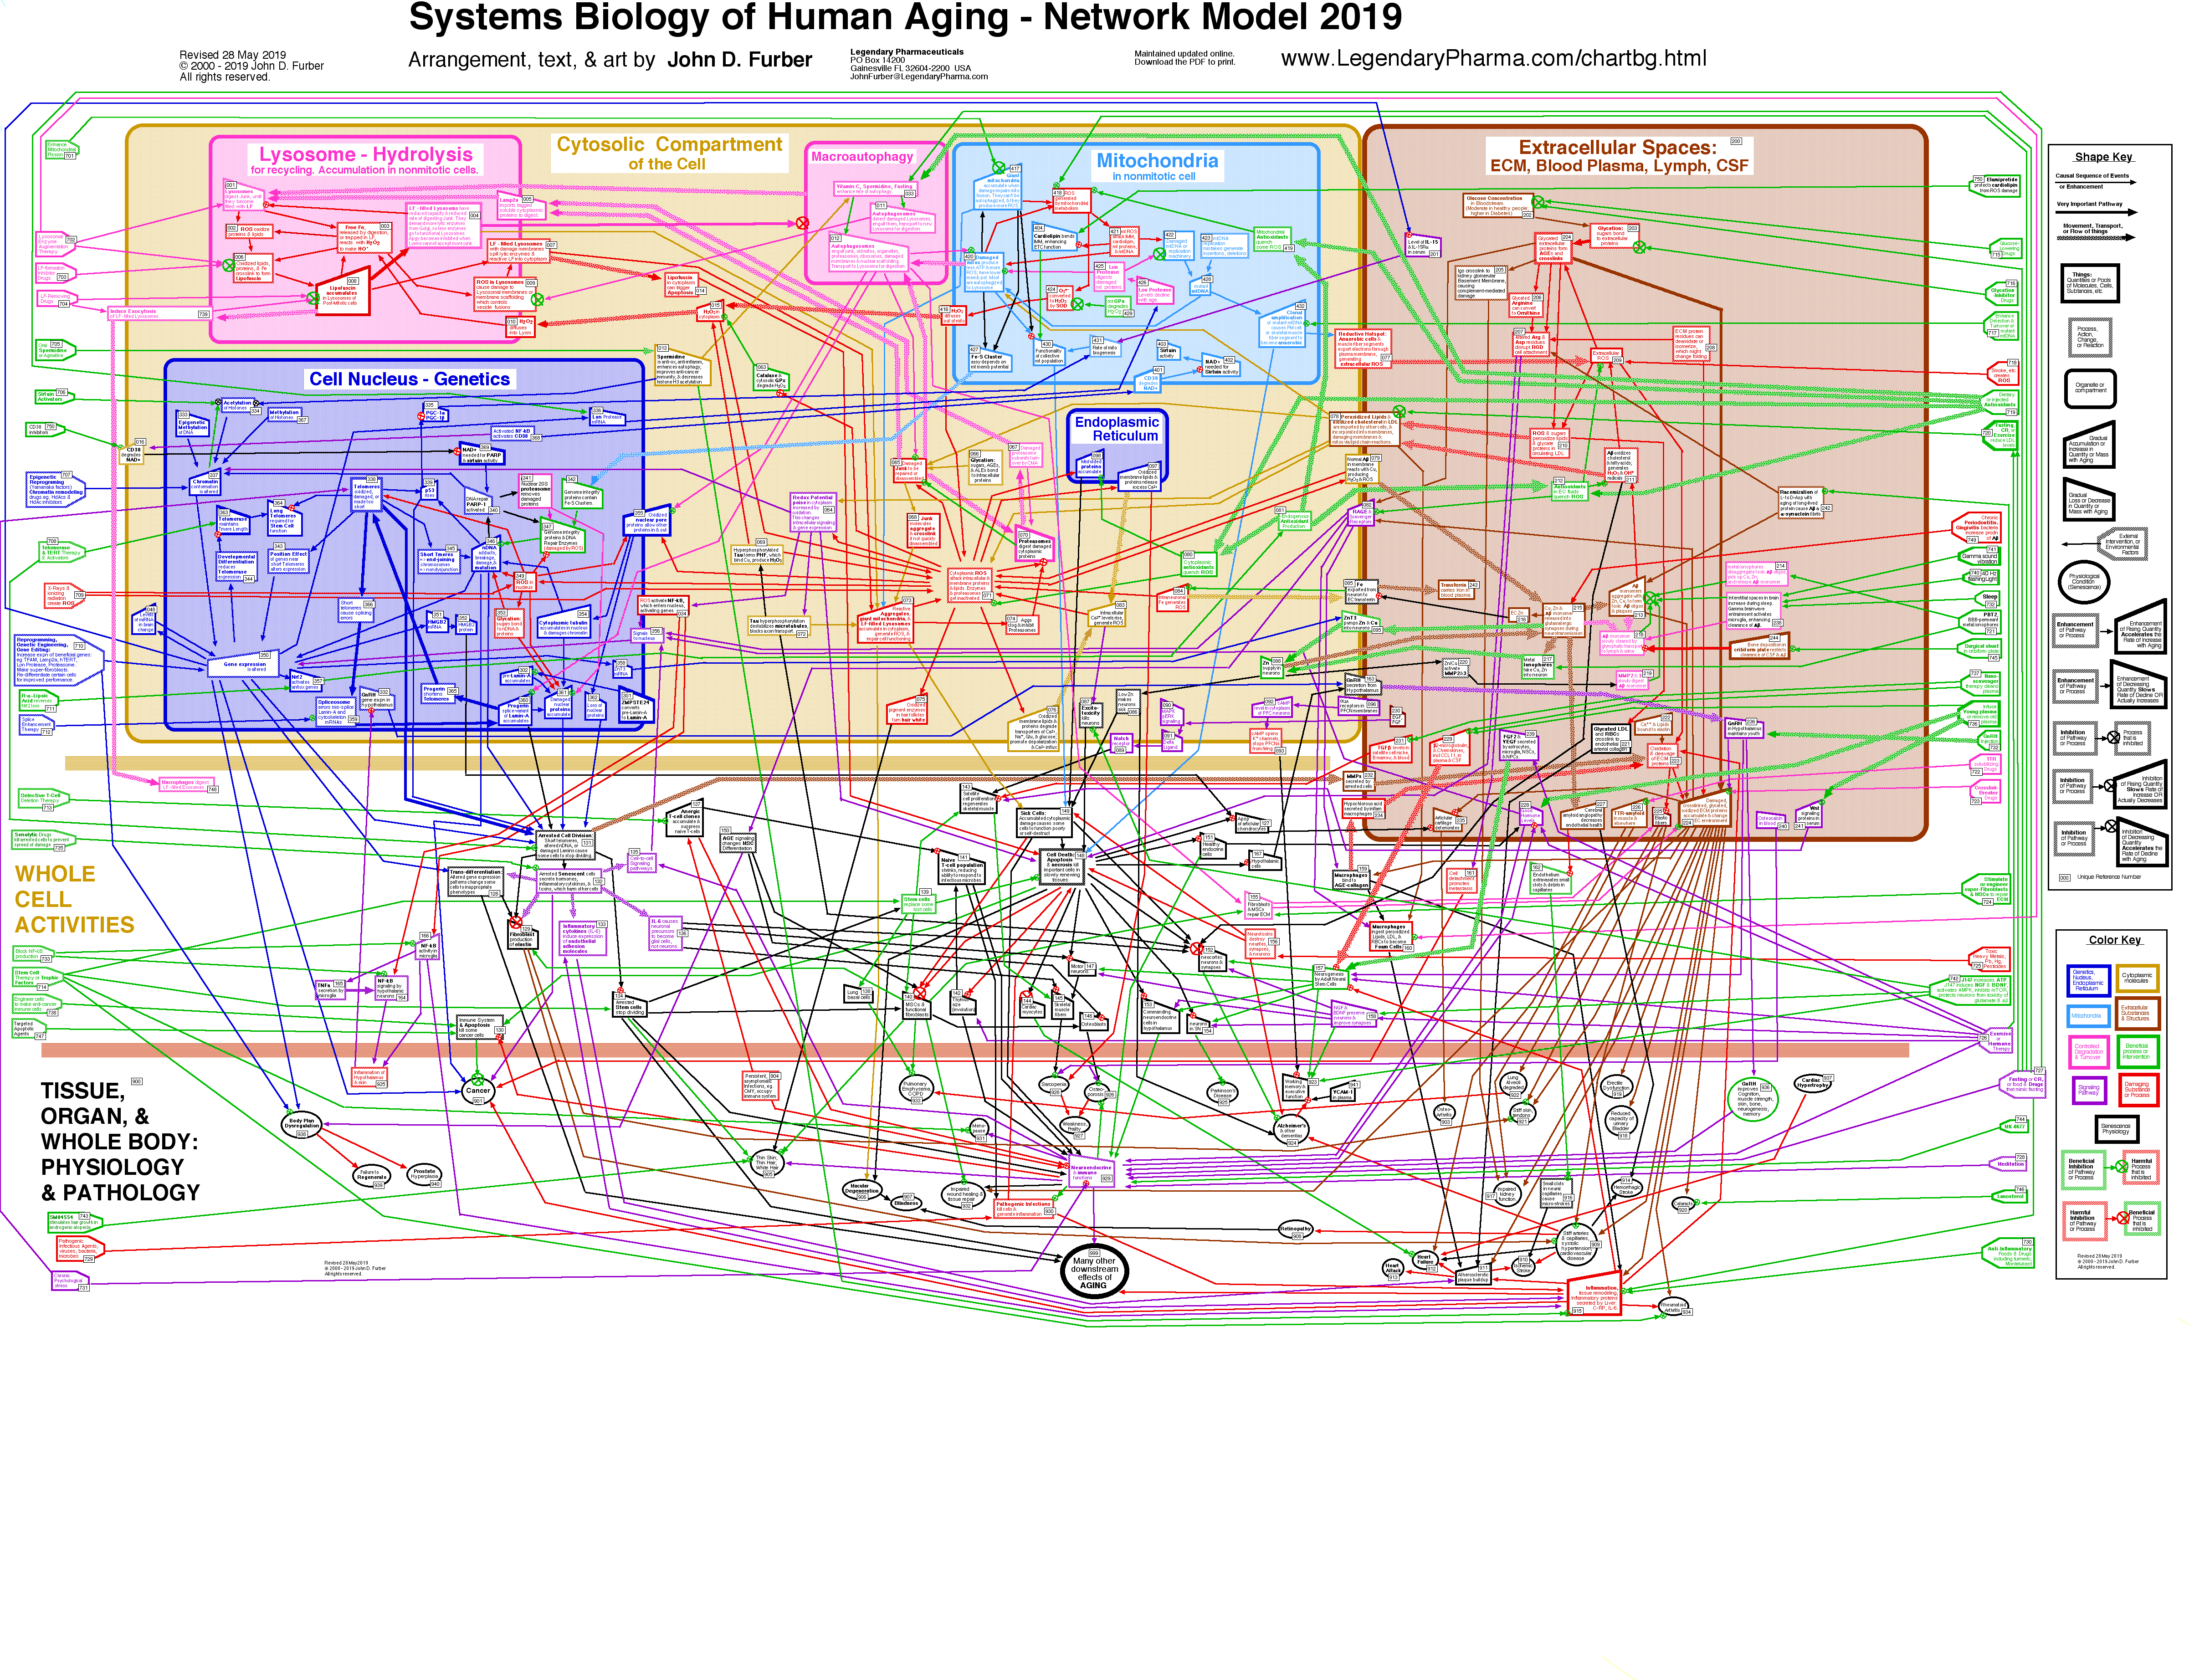
This Network Model of Human Senescence was compiled and arranged by John D. Furber, based upon information in research reports from many scientists. You may cite this chart as
John D. Furber. Systems Biology of Human Aging - Network Model Wall Chart.
(Rev 2 June 2026)
© 2010-2026 by John D. Furber. All rights Reserved.
Permalink to the latest version: https://www.LegendaryPharma.com/chartbg.html
References and links to more information about these topics may be found at:
Keywords may be searched at your favorite reference or search system. For example:
A good, short review of aging mechanisms was published in the journal, Nature by Jan Vijg & Judith Campisi. (2008)
Puzzles, promises and a cure for ageing.
Nature, 454, 1065-1071.
Special thanks go to the following scientists for their helpful suggestions on earlier versions of this network diagram, which were used to update it to its current form:
(Alphabetical listing)
Arthur Balin, Joe Betts-Lacroix,
Robert Bradbury (deceased),
Ulf T. Brunk, Alexander Buerkle, Ashley I. Bush,
Irina Conboy, Michael Conboy, Richard G. Cutler,
Aubrey de Grey, Juraj Dzifcak,
Caleb Finch, Allen Herbst, Thomas E. Johnson,
James Joseph (deceased),
Pat Langley,
George M. Martin (deceased),
Mark P. Mattson, Florian Muller,
Mark A. Smith (deceased),
Stanley Primmer, Stephen A. Racunas,
Alexandra Stolzing, Alexei Terman,
Bill Vaughan (deceased),
Michael Verdicchio
|
| |
 |
This Network Model has been used as the Basis
of Research and Writing by Others:
- Longecity forum topic started by VidX, 15 June 2011
https://www.longecity.org/forum/topic/49770-impressive-chart-systems-biology-of-human-aging/
- Daniel Bryce, Michael Verdicchio, Seungchan Kim. "Planning Interventions in Biological Networks,"
ACM Transactions on Intelligent Systems and Technology (TIST) archive.
Vol 1 Issue 2, November 2010. doi 10.1145/1869397.1869400
https://portal.acm.org/citation.cfm?doid=1869397.1869400
- Accelerating Future blog by Michael Anissimov, 18 Oct 2010.
https://www.acceleratingfuture.com/michael/blog/2010/10/john-d-furbers-comprehensive-aging-graph/
- This network model was one of several which formed the basis of discussion at the Symposium on the Systems Biology of Human Aging at the National Institute on Aging, Baltimore, Maryland, 8-9 December 2009.
- Science and health writer Joyce Wall featured this network model in her article, "Aging and Antioxidants: finding a magic bullet in a biological battlefield of free radicals", Examiner.com, 25 October 2009.
- This network model was one of several which formed the basis of discussion at the Symposium on the Systems Biology of Aging at Arizona State University, 6-7 December 2008.
https://legendarypharma.com/meetings/2008ASU_SysBioAging/aging.html
- Louisa Dalton featured this network model in "Assembling The Aging Puzzle:
Computation Helps Connect the Pieces," Biomedical Computation Review, Spring 2008.
https://biomedicalcomputationreview.org/4/2/index.html
- Science fiction writer Bruce Sterling reviewed this Systems Biology Network Model of Aging Wall Chart on his Wired blog, "Beyond the Beyond" November 18, 2007.
https://www.wired.com/beyond_the_beyond/2007/11/the-why-you-get/
- VisualComplexity.com intends to be a unified resource space for anyone interested in the visualization of complex networks. This network model is reviewed at:
www.visualcomplexity.com/vc/project.cfm?id=521
- Cool Infographics is a blog about infographics that turn data into information. This network model was reviewed 24 Nov 2007:
coolinfographics.blogspot.com/2007_11_01_archive.html
- Ouroboros "Research in the biology of aging." Ouroboros reviewed this network model on 13 Aug 2007:
ouroboros.wordpress.com/2007/08/13/molecular-events-of-aging-posterflowchart/#comment-39549
- GrailSearch.org "Researching Engineered Longevity. Searching for emergent engineering concepts for the sake of longevity in systems biology, informatics, computational chemistry, genetics, and biochemistry." GrailSearch reviewed this network model on 13 Aug 2007:
The link "https://grailsearch.org/?q=node/50" is no longer active. You might try the Internet Wayback Machine, if interested.
ORDERING POSTER PRINTS
Please see the next section to download the file and have it printed in large format at your favorite print shop.
- Artist signature: Upon request, the artist will autograph your copy.
- Sponsored Printing: Your organization or company can cover the cost of printing a batch of posters on large-format paper. An acknowledgment and your logo can be printed on the posters. This will lower the cost to scientists, students, and interested individuals. You can also distribute posters directly.
- To enquire regarding larger sizes, quantity discounts, classroom use, sponsorship, or foreign addresses,
please email: JohnFurber at LegendaryPharma com
--PRINT IT YOURSELF--
How to DOWNLOAD a PRINTABLE PDF
for Large Format Prints.
You may print a single copy of this network diagram for personal or educational purposes. You must agree to keep all elements of the image visible together, including the copyright notice, web address, and creator's name.
Please send a Royalty or Donation of $10 per print to support this ongoing work.
To pay by check, please email to request details to JohnFurber at LegendaryPharma com. You will receive an email on where to send the check.
To pay by PayPal, please email for instructions.
BUT WAIT! Do not download the image displayed above on this page; it is in a file format that is not ideal for high-quality printing.
Please see below to download a high-quality PDF file, formatted for high-resolution printing on large-format paper.
This is a scalable, vector-graphic PDF.
You may adjust your software to print a larger or smaller image, to match your printer paper size.
Also, please download the file "chartintro.pdf" formatted to print the explanatory information on 8.5 x 11 inch paper.
- [ Click Here to download the Wall Chart ==> furberchart.pdf ]
- [ Click Here to download printable introductory text pages for display with the wall chart: "Abstract", "Getting Started", "Abbreviations", and "Acknowledgements and Citations." ==> chartintro.pdf 160 kB ]
- [ Click Here to download the printable references, sources, and expansions of the text boxes: ==> chartrefs.pdf 139 kB ]
SHOW THE WORLD
After you put up the poster, please send an email to tell us where the poster is displayed, and please email a photo of the chart on your wall, with you and your associates beside it. We will be starting a web page of photos from labs, classrooms, and clinics around the world.
COPYRIGHT and PRESENTATION HISTORY
Earlier versions of this network model were presented by John D. Furber in lectures or poster sessions at many meetings, including the following:
- Oxygen Club of California World Congress 2015:
"Oxidants and Antioxidants in Biology" (Valencia, Spain, June 2015)
This symposium was a joint meeting with The Spanish Group for Research on Free Radicals, The Portuguese Group of Free Radicals, and Le Soci�t� Fran�aise de Recherches sur les Radicaux Libres. Also supported by the Society for Free Radical Research International.
www.rosvalencia.eu/
- American Aging Association
(Marina del Rey, Caifornia, June 2015)
- Rejuvenation Biotechnologies, RB2014 (Santa Clara, California, Aug 2014)
- American Aging Association
(San Antonio, Texas, June 2014)
- Bay Area Aging Symposium (University of California Berkeley, May 2014)
- Bay Area Aging Symposium (Stanford University, California, November 25, 2013)
- Rejuvenation Biotechnologies, Sixth SENS Conference (SENS6) (Queens' College, Cambridge, England, September 2013)
- 5th International Symposium Nutrition, Oxygen Biology and Medicine:
Development and Aging: Nutrition, Epigenetic and Lifestyle consequences to the healthspan. Hosted by the French Society of Free Radical Research, a component of SFRR Europe. This symposium was a joint meeting with the Oxygen Club of California (OCC). (Paris, France, June 2013)
- American Aging Association
(Baltimore, Maryland, June 2013)
- Bay Area Aging Symposium (Buck Institute for Research on Aging, Novato, California, April 1, 2013)
- Eurosymposium on Healthy Ageing (EHA) (Brussels, Belgium, December 12-14, 2012)
- Bay Area Aging Symposium (Gladstone Institutes, San Francisco, California, November 26, 2012)
- Gerontological Society of America (San Diego, California, 14-18 November 2012)
- Cold Spring Harbor Laboratory meeting on Aging: "The Molecular Genetics of Aging" (Cold Spring Harbor, New York, October 9-13, 2012)
- American Aging Association
(Fort Worth, Texas, June 2012)
- Buck Institute Symposium on Stem Cell Research and Aging
(Buck Institute for Research on Aging, Novato, California, March 2012)
- Rejuvenation Biotechnologies, Fifth SENS Conference (SENS5) (Queens' College, Cambridge, England, September 2011)
- American Aging Association
(Raleigh, North Carolina, June 2011)
- Hunan Normal University, College of Life Sciences (Changsha, China, 2 December 2010) Invited lecture.
- Collaborative Drug Discovery (UCSF Mission Bay Campus, San Francisco, 21 October 2010)
- Cold Spring Harbor Laboratory Meeting on the Molecular Biology of Aging, (Cold Spring Harbor, New York, September 2010)
- Gordon Research Conference on the Biology of Aging, (Les Diablerets, Switzerland, August 2010)
- American Aging Association
(Portland, Oregon, June 2010)
- Oxygen Club of California (Santa Barbara, March 2010)
- Symposium on the Systems Biology of Human Aging, National Institute on Aging, Baltimore, Maryland, 8-9 December 2009)
- Gerontological Society of America (Atlanta, Georgia, 21-25 November 2009)
- Manhattan Beach Project Longevity Summit 2009,
(Manhattan Beach, California, 13-15 November 2009)
https://www.manhattanbeachproject.com/
- Strategies for Engineered Negligible Senescence (SENS4), Fourth Conference (Queens' College, Cambridge, England, September 2009)
- American Aging Association (Scottsdale, Arizona, May-June 2009)
- Symposium on the Systems Biology of Human Aging (Arizona State University, Tempe, Arizona, 6-7 December 2008)
- 6th European Congress of Biogerontology 2008 (Noordwijkerhout, The Netherlands, 30 November - 3 December 2008)
- Gerontological Society of America (Washington DC, 21-25 November 2008)
- NIH Mitochondria Mini-symposium (Bethesda, Maryland, 19 November 2008)
- Collaborative Drug Discovery (UCSF Mission Bay Campus, San Francsico, 7 October 2008)
- Understanding Aging: Biomedical and Bioengineering Approaches (UCLA, California, 27-29 June 2008)
- 2nd International Genome Dynamics in Neuroscience Conference.
"Genome Dynamics and Instability in the Aging brain" (Asilomar Conference Center, California, 13-17 June 2008)
- American Aging Association (Boulder, Colorado, May-June 2008)
- Gordon Research Conference on Autophagy In Stress, Development & Disease, (Ventura, California, January 2008)
- Gerontological Society of America (San Francisco, November 2007)
- Buck Institute Symposium 2007, Buck Institute for Age Research (Novato, California, November 2007)
- Gordon Research Conference on the Biology of Aging, (Les Diablerets, Switzerland, September 2007)
- Linköping University, Department of Pharmacology, (Linköping, Sweden, September 2007) Invited lecture.
- Strategies for Engineered Negligible Senescence (SENS3), Third Conference (Queens' College, Cambridge, England, September 2007)
- American Aging Association
(San Antonio, Texas, June 2007)
- Edmonton Aging Symposium (Edmonton, Alberta,Canada, March 2007)
- European Conference on Aging, ECONAG 2006 (Innsbruck, Austria, November 2006)
- Gerontological Society of America (Dallas, Texas, November 2006)
- American Aging Association
(Boston, Massachusetts, June 2006)
- The Simons Center for Systems Biology & Kavli Institute for Theoretical Physics Conference:
"Determination of Longevity", (Institute for Advanced Study, Princeton, New Jersey, May 2006)
- Oxygen Club of California (Santa Barbara, March 2006)
- Gordon Research Conference on the Biology of Aging: "From Cells to Centenarians: New Concepts, Old Problems" (Ventura, California, January - February 2006)
- Gerontological Society of America (Orlando, Florida, November 2005)
- San Antonio Nathan Shock Aging Center Conferences on Aging: "The Role of Protein Misfolding and Aggregation on Aging and Age-Related Disorders," (Banderas, Texas, October 2005)
- Strategies for Engineered Negligible Senescence (SENS2), Second Conference (Queens' College, Cambridge, England, September 2005)
- International Association of Biomedical Gerontology, 11th Congress, "Understanding and Modulating Ageing" (Aarhus, Denmark, August 2005)
- American Aging Association
(Oakland, California, June 2005)
- Gerontological Society of America (Washington DC, November 2004)
- International Association of Biomedical Gerontology, 10th Congress: "Strategies for Engineered Negligible Senescence: Reasons Why Genuine Control of Aging may be Foreseeable" (Queens' College, Cambridge, England, September 2003)
- Los Angeles Gerontology Research Group (Los Angeses, August 2003)
- American Aging Association
(Baltimore, June 2003)
- Linköping University, Department of Pathology, (Linköping, Sweden, October 2002) Invited lecture.
- SMi Conference Series, "Anti-Ageing Therapies," (London, England, October 2002)
- Strategic Research Institute, "Anti-Aging Drug Discovery and Development Summit: The Molecular Basis of Aging and Commercial Prospects for Therapeutics in Aging Intervention." (San Francisco, October 2002)
- American Aging Association
(San Diego, June 2002)
- Oxygen Club of California (Santa Barbara, March 2002)
- Smart Life Forum (Palo Alto, California, December 2001)
- Gerontological Society of America (Chicago, November 2001)
- Center for Research and Education on Aging (CREA) "The New Science of Aging: A Symposium and Fair," (Berkeley, California, October 2001)
- International Association of Biomedical Gerontology, 9th Congress (Vancouver, Canada, June 2001)
- American Aging Association (Madison, Wisconsin, June 2001)
|
|
Please Send feedback, suggested references, and suggestions for improvements: Please email us if you see errors to correct, or if you can suggest ways to improve the clarity or utility of this Network Model as a tool for teaching or research. If you suggest a reference, please identify the box or boxes to which it applies (and the DATE version you are looking at), and a brief (1-3 sentences) summary of how this reference applies. Please also tell us if you are using this chart in your classroom, research institute, or clinic.
Write johnfurber at LegendaryPharma com. |
|
|
Hot Topics
Navigation
We are a participant in the Amazon Services LLC Associates Program, a program designed to provide for sites to earn fees by linking to amazon.com. As an Amazon Associate, we earn from qualifying purchases.
© 2010-2026 by John D. Furber. All rights Reserved.
|
|